The Power of Color in Finance and Analysis: Making Data Tell Its Story
In the world of numbers, spreadsheets, and complex datasets, clarity is king. Yet, the raw data itself is often a monochrome sea of digits—a landscape that can be difficult to navigate and interpret. This is where the Colorful Finance and Analysis Concept comes into play, transforming sterile tables into vibrant, communicative visuals. It’s not merely about making reports look attractive; it’s a fundamental strategy for enhancing comprehension, speeding up decision-making, and ensuring key insights jump off the page.
Why Color Is More Than Just Decoration
At its core, financial analysis is about discerning patterns, spotting trends, and identifying exceptions. Human brains are exceptionally good at processing visual information, especially color. When applied thoughtfully within the Colorful Finance and Analysis Concept, color serves several critical functions:
- Categorical Differentiation: Using distinct hues to separate departments, product lines, geographic regions, or time periods allows viewers to instantly group related data without reading labels.
- Highlighting Variance: A spectrum from cool to warm colors (e.g., blue to red) can intuitively show performance, from under-target to exceeding expectations.
- Emphasizing Critical Data Points: A bold, contrasting color draws immediate attention to outliers, key metrics, or warning flags that require action.
- Establishing Visual Hierarchy: Colors help guide the viewer’s eye through an infographic or dashboard, showing what’s most important and how secondary data supports it.
Without this visual coding, analysts and stakeholders must spend extra cognitive energy parsing rows and columns, a process that is slower and more prone to error.
The Psychology Behind the Palette
Effective color use in finance isn’t random. It leverages common psychological associations to reinforce the message. For instance, red often signals danger, loss, or a downward trend, while green suggests growth, profit, or positivity. Blue conveys stability and trust, frequently used for baseline or historical data. Yellow or orange can act as alerts for caution or moderate performance. A well-executed Colorful Finance and Analysis Concept infographic uses these associations consistently, creating an almost instinctual understanding for the viewer.
However, it’s vital to remain mindful of context and culture. The goal is to aid understanding, not confuse it. Consistency across all reports within an organization is key—if revenue is always green in one chart but blue in another, the visual language breaks down.
Implementing Colorful Analysis in Modern Workflows
Today’s analytics platforms and software, from Excel and Google Sheets to specialized tools like Tableau and Power BI, are built with color functionality at their heart. Adopting the Colorful Finance and Analysis Concept means moving beyond default settings to intentional design.
In a typical monthly business review, a dashboard might employ a color scheme where:
- A main KPI gauge uses a green-to-red gradient to show current vs. target.
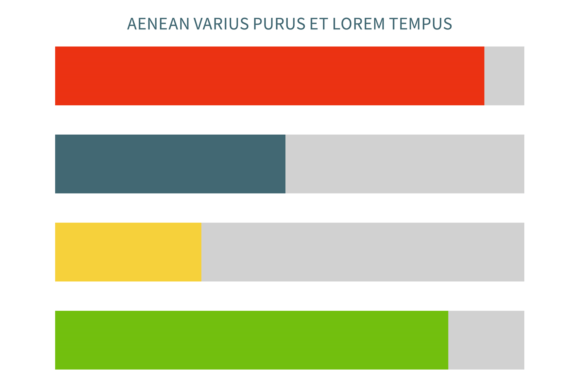
- Bar charts for departmental budgets use varied but harmonious colors to differentiate each team.
- A line graph tracking quarterly sales uses a strong, unique color for the current year, while past years are shown in muted grays, pushing focus to the present trend.
This approach fits seamlessly into agile and fast-paced environments. Decision-makers, who may not be data experts, can grasp the situation in seconds. It reduces meeting time spent explaining the data and increases time spent discussing actions.
Practical Benefits for Teams and Stakeholders
The practical advantages are measurable. Clarity reduces misinterpretation. Speed of analysis improves, allowing for more responsive strategy adjustments. Furthermore, a well-designed, colorful report is more engaging, which can increase stakeholder buy-in and make the often-dry process of financial review more accessible to broader teams.
Consider a scenario where an analyst presents cash flow projections. A monochrome table might show numbers going negative in future months. But applying the Colorful Finance and Analysis Concept—shading those negative cells in a gradual shift from yellow to red—makes the impending risk visually unavoidable. The urgency is communicated not just by the number, but by its presentation.
Key Considerations Before Adopting a Color Strategy
While the benefits are clear, implementing a successful Colorful Finance and Analysis Concept requires forethought. Here are common factors teams should address:
Accessibility is Paramount: Color should never be the only means of conveying information. Consider viewers with color vision deficiencies. Use patterns, text labels, or data labels alongside color. Many tools allow you to check charts for accessibility compliance.
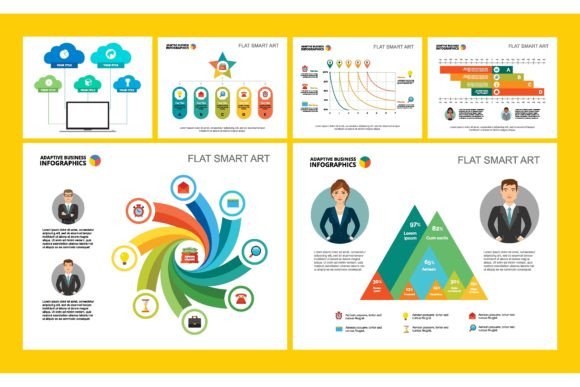
Avoid the Rainbow Effect: Too many colors create chaos. Limit your palette. A good rule is to use a primary color for the main focus, a secondary color for comparison, and a neutral (like gray) for context or baseline data. Specialty infographic sets often provide curated, harmonious palettes designed for this purpose.
Context Over Consistency: While internal consistency is important, also consider the final output. A report printed in black and white loses all color coding. Ensure key differentiations are still clear through spacing, labels, or patterns.
Training and Guidelines: Adopting a standard color schema across an organization may require brief training or the creation of a style guide. This ensures that when the marketing team’s “red” means “high engagement,” the finance team isn’t using the same red to mean “budget overrun.”
From Static Reports to Dynamic Dashboards
The Colorful Finance and Analysis Concept evolves with technology. In interactive dashboards, color can become dynamic. For example, a metric might automatically turn red if it falls below a live threshold, enabling real-time monitoring. This active use of color transforms analysis from a retrospective activity to a proactive management tool.
In industries like fintech, real estate analytics, or retail management, these dynamic, colorful dashboards are central to daily operations. They allow teams to watch market movements, inventory turnover, or campaign performance with immediate visual feedback, making the data’s story continuous and actionable.
Crafting Your Own Visual Narrative
Ultimately, the Colorful Finance and Analysis Concept is about narrative. Every dataset has a story: a trend of growth, a problem to solve, a comparison to evaluate. Color is the tool that highlights the protagonists, underlines the conflict, and celebrates the resolution in that story.
Start simple. In your next financial model or performance summary, consciously choose colors for just two things: your primary success metric and your primary risk metric. Observe how it changes the focus of your own review and the discussion with colleagues. As you iterate, build a palette that serves your specific needs—one where the colors themselves become a silent, yet powerful, part of your analytical language.
By embracing this concept, you move from simply calculating numbers to truly communicating their meaning, ensuring that your hard work in analysis doesn’t just end up in a file, but drives informed action and understanding.